1. Analytics Dashboard activity feed analytics chart dashboard funnel graphs product settings statistics ui ux
    View Analytics Dashboard
    Analytics Dashboard
    275
    73.8k
  2. πŸ“Š Bar Chart actions analytics bar chart card chart clean component dashboard design graph green minimal phishing simple stacked stats typography ui url ux
    View πŸ“Š Bar Chart
    πŸ“Š Bar Chart
    108
    43.9k
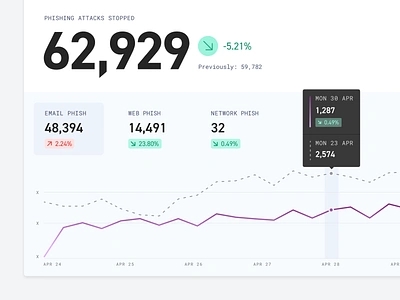
  3. πŸ’₯ Phishing Attacks analytics attacks chart clean component dashboard design line graph minimal phishing security simple typography ui ux
    View πŸ’₯ Phishing Attacks
    πŸ’₯ Phishing Attacks
    237
    39.9k
  4. Uber Movement for Mobility bikes charts dashboard data graph icons map scooters uber ui design ux design
    View Uber Movement for Mobility
    Uber Movement for Mobility
    325
    46.6k
  5. πŸ‘½Dashboard Rules / Zome dashboard dashboard ui desktop desktop app desktop application device ui energy light light ui product design ui ui dashboard user interface ux web web app web app design web application web application design web ui
    View πŸ‘½Dashboard Rules / Zome
    πŸ‘½Dashboard Rules / Zome
    129
    28.2k
  6. πŸ“ˆ Activity Summary activity automation bot chart clean component dashboard design filters line chart list log minimal search simple sparkline ui ux
    View πŸ“ˆ Activity Summary
    πŸ“ˆ Activity Summary
    231
    78.3k
  7. Saasler - Dashboard api charts clean dashboard integrations lines material design metrics red ui users
    View Saasler - Dashboard
    Saasler - Dashboard
    215
    14.7k
  8. Uber Movement for New Mobility charts data data design graph maps tools uber uber design ui design
    View Uber Movement for New Mobility
    Uber Movement for New Mobility
    564
    77.9k
  9. Places and business analytics business colors connection friends internet pending places red share shoutouts wifi
    View Places and business
    Places and business
    71
    8.4k
  10. Dashboard – Statistics dashboard design framer mollie navigation prototype sidebar
    View Dashboard – Statistics
    Dashboard – Statistics
    234
    26.2k
  11. CryptoCoin- Light Version app app concept bitcoin blockchain charts cryptocurrency dashboard etherium interaction ripple ui ux
    View CryptoCoin- Light Version
    CryptoCoin- Light Version
    447
    30.5k
  12. Price Prediction - peek into the future to avoid price increases ai big data data science interaction design machine learning prediction price ui urgency ux
    View Price Prediction - peek into the future to avoid price increases
    Price Prediction - peek into the future to avoid price increases
    73
    10.9k
  13. Uber Healthline analysis app health dashboard data tools data visualization developer platform internal tools product design uber uber design
    View Uber Healthline
    Uber Healthline
    237
    48k
  14. Field Ticket Analytics analytics bar graph charts data line graph statistics
    View Field Ticket Analytics
    Field Ticket Analytics
    211
    23.7k
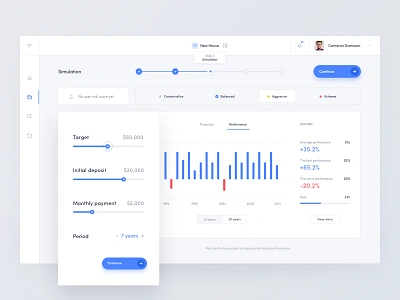
  15. Robo Advisor - Projection bar chart dashboard finance financial gauge graph icons onboarding progress bar statistics stats steps
    View Robo Advisor - Projection
    Robo Advisor - Projection
    3.5k
    457k
  16. Experimentation Analysis: Time Segmentation analysis data visualization dataviz experimentation time uber uber design
    View Experimentation Analysis: Time Segmentation
    Experimentation Analysis: Time Segmentation
    145
    37.7k
  17. Dashboard for Payroll & HR analytics chart component dashboard desktop graph modular sidebar stats tasks todo web
    View Dashboard for Payroll & HR
    Dashboard for Payroll & HR
    346
    62.5k
  18. Experimentation Analysis: Time Series analysis chart data visualization dataviz experimentation uber uber design
    View Experimentation Analysis: Time Series
    Experimentation Analysis: Time Series
    249
    53k
  19. Experimentation Analysis: Performance Summary analysis card data visualization dataviz experimentation marketplace product design uber uber design ui
    View Experimentation Analysis: Performance Summary
    Experimentation Analysis: Performance Summary
    526
    103k
  20. Icon tool tip design graph ui interface design interface designer typography ui user experience user interface ux
    View Icon tool tip
    Icon tool tip
    146
    31.5k
  21. Invocable - App UI Transitions analytics application bar chart chart cohort cohort analysis dashboard data management data visualisation data visualization interace mobile dashboard mobile report mobile ui design report report design retention retention analysis retention report sparkline
    View Invocable - App UI Transitions
    Invocable - App UI Transitions
    639
    149k
  22. πŸ’°πŸ“ˆ Financial Goals card chart clean dasboard design finance money simple ui ux white
    View πŸ’°πŸ“ˆ Financial Goals
    πŸ’°πŸ“ˆ Financial Goals
    197
    21.9k
  23. Segment Event Delivery app b2b dashboard data enterprise software segment ui vizualization web
    View Segment Event Delivery
    Segment Event Delivery
    56
    13k
  24. Reporting Applications clean data data table graph job recruiting reporting ui ux web
    View Reporting Applications
    Reporting Applications
    87
    31.1k
Loading more…