Find designers
Designer search
Quickly find your next designer
Post a job
The #1 job board for design talent
Inspiration
Jobs
Go Pro
Log in
Dribbble: the community for graphic design
Log in
Sign up
graphs
Facebook icon
Share
Twitter icon
Tweet
Copy
8 Shots
•
8 Designers
MtheB
Facebook icon
Share
Twitter icon
Tweet
Copy
Shot Link
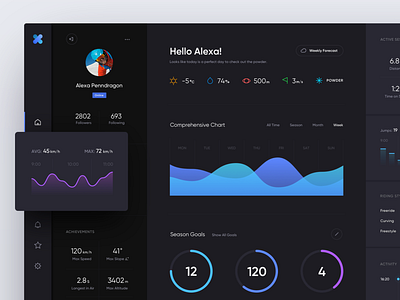
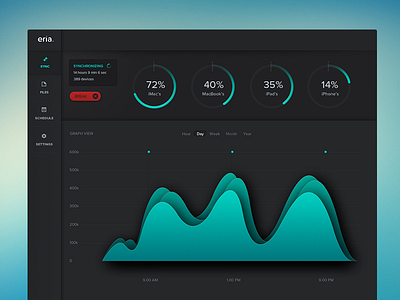
View Snowboarding Dashboard Dark
Snowboarding Dashboard Dark
Like
Den Klenkov
Pro
Like
848
346k
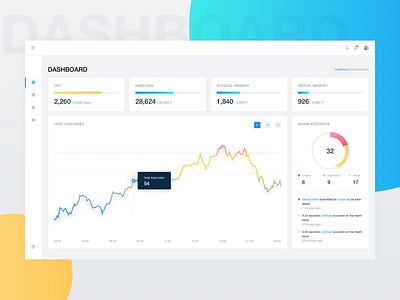
View Monitor
Monitor
Like
Lujues
Like
28
4.4k
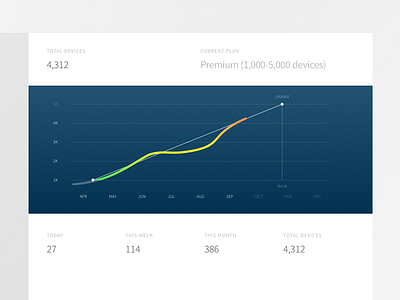
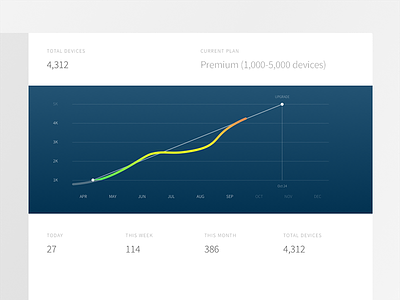
View oneID Developer Graph
oneID Developer Graph
Like
Parker Ehret
Like
19
3.9k
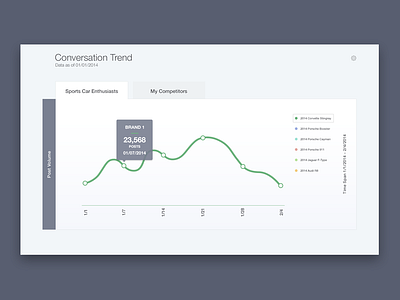
View Conversation Trend
Conversation Trend
Like
Rovane Durso
Pro
Like
156
5.9k
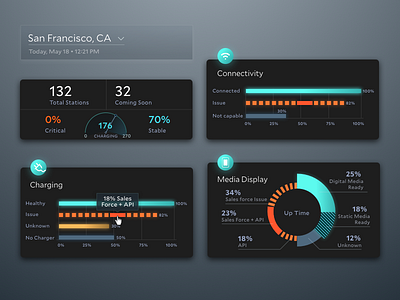
View darkboard full
darkboard full
Like
vandal
Like
88
2.8k
View React Components
React Components
Like
Bradley Bussolini
Like
90
28.7k
View Kizen Dash
Kizen Dash
Like
Unfold
Team
Like
240
31.1k
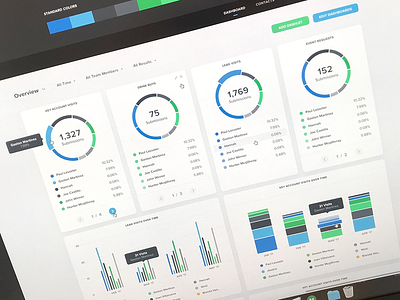
View Infographics
Infographics
Like
Callum Chapman
Like
212
14.7k
Sign up to continue
Loading more…
Previous
Next
Loading…