1. Concentric Circles Diagram Illustrator Infographic analytics analytics chart annual report chart data data analysis data visualisation data visualization data viz dataviz graph info info graphics infographic infographic elements infographics infography information statistics stats
    View Concentric Circles Diagram Illustrator Infographic
    Concentric Circles Diagram Illustrator Infographic
    172
    36.2k
  2. hae x Canopy Infographics (02) animation charts data data visualizations deck graphic design graphs hae hae design infographic infographics keynote marketing report motion graphics pitch deck powerpoint ppt presentation statistics venn diagram
    View hae x Canopy Infographics (02)
    hae x Canopy Infographics (02)
    2
    267
  3. Venn abstract abstract design illustration illustrator jobs tech venn venn diagram
    View Venn
    Venn
    141
    35.9k
  4. Venn Diagram pattern texture venn diagram
    View Venn Diagram
    Venn Diagram
    58
    12k
  5. Colorful Venn Diagram Powerpoint Template (DOWNLOAD FREE) diagram powerpoint simple simple design venn venn diagram
    View Colorful Venn Diagram Powerpoint Template (DOWNLOAD FREE)
    Colorful Venn Diagram Powerpoint Template (DOWNLOAD FREE)
    6
    3.2k
  6. Ecosystem Partnership Map connections diagram ecosystem graphic infographic map mind map network science venn diagram
    View Ecosystem Partnership Map
    Ecosystem Partnership Map
    6
    4.5k
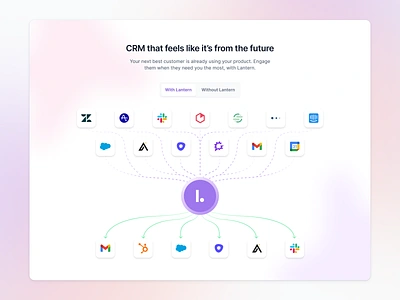
  7. Product "how it works" illustration analytics apollo before after crm explanation filter funnel gmail gong heap how it works hubspot illustration integration intercom outreach salesforce segment slack zendesk
    View Product "how it works" illustration
    Product "how it works" illustration
    200
    54.6k
  8. Data Dashboard P1 admin bar chart dark dashboard data dataviz graph green reporting sales
    View Data Dashboard P1
    Data Dashboard P1
    227
    24k
  9. Analytics App - Dashboard analytics bar chart dashboard event graph ios isometric rational stats tab tracking
    View Analytics App - Dashboard
    Analytics App - Dashboard
    282
    34.4k
  10. Dashboard Dark Version activity bar chart best crm dashboard graph line chart list radar chart table ui ux web app
    View Dashboard Dark Version
    Dashboard Dark Version
    266
    51.9k
  11. Editorial Page editorial illustration info graphic information design magazine statistic watercolor
    View Editorial Page
    Editorial Page
    346
    12.4k
  12. Pie chart blue chart graph illustration report ui ux web
    View Pie chart
    Pie chart
    98
    26.7k
  13. Global perspective investing for good artwork branding conceptual corporate data editorial finance graph illustration pie chart
    View Global perspective investing for good
    Global perspective investing for good
    8
    1.6k
  14. Calendar Pie Chart calendar lens flare pie chart vector
    View Calendar Pie Chart
    Calendar Pie Chart
    13
    1.2k
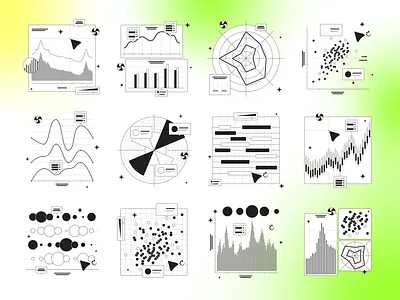
  15. Charts Illustrations abstract black chart data design diagram free freebie illustration kapustin pie resources set vector white
    View Charts Illustrations
    Charts Illustrations
    121
    21.5k
  16. Growth #2 - Change of perspective abstract bouncing geometrical growth minimal perspective plant primary seed shapes
    View Growth #2 - Change of perspective
    Growth #2 - Change of perspective
    245
    29.5k
  17. CI/CD Tools Comparison abstract app bright flat gradient icon loop shadow symbol tech tool
    View CI/CD Tools Comparison
    CI/CD Tools Comparison
    152
    22k
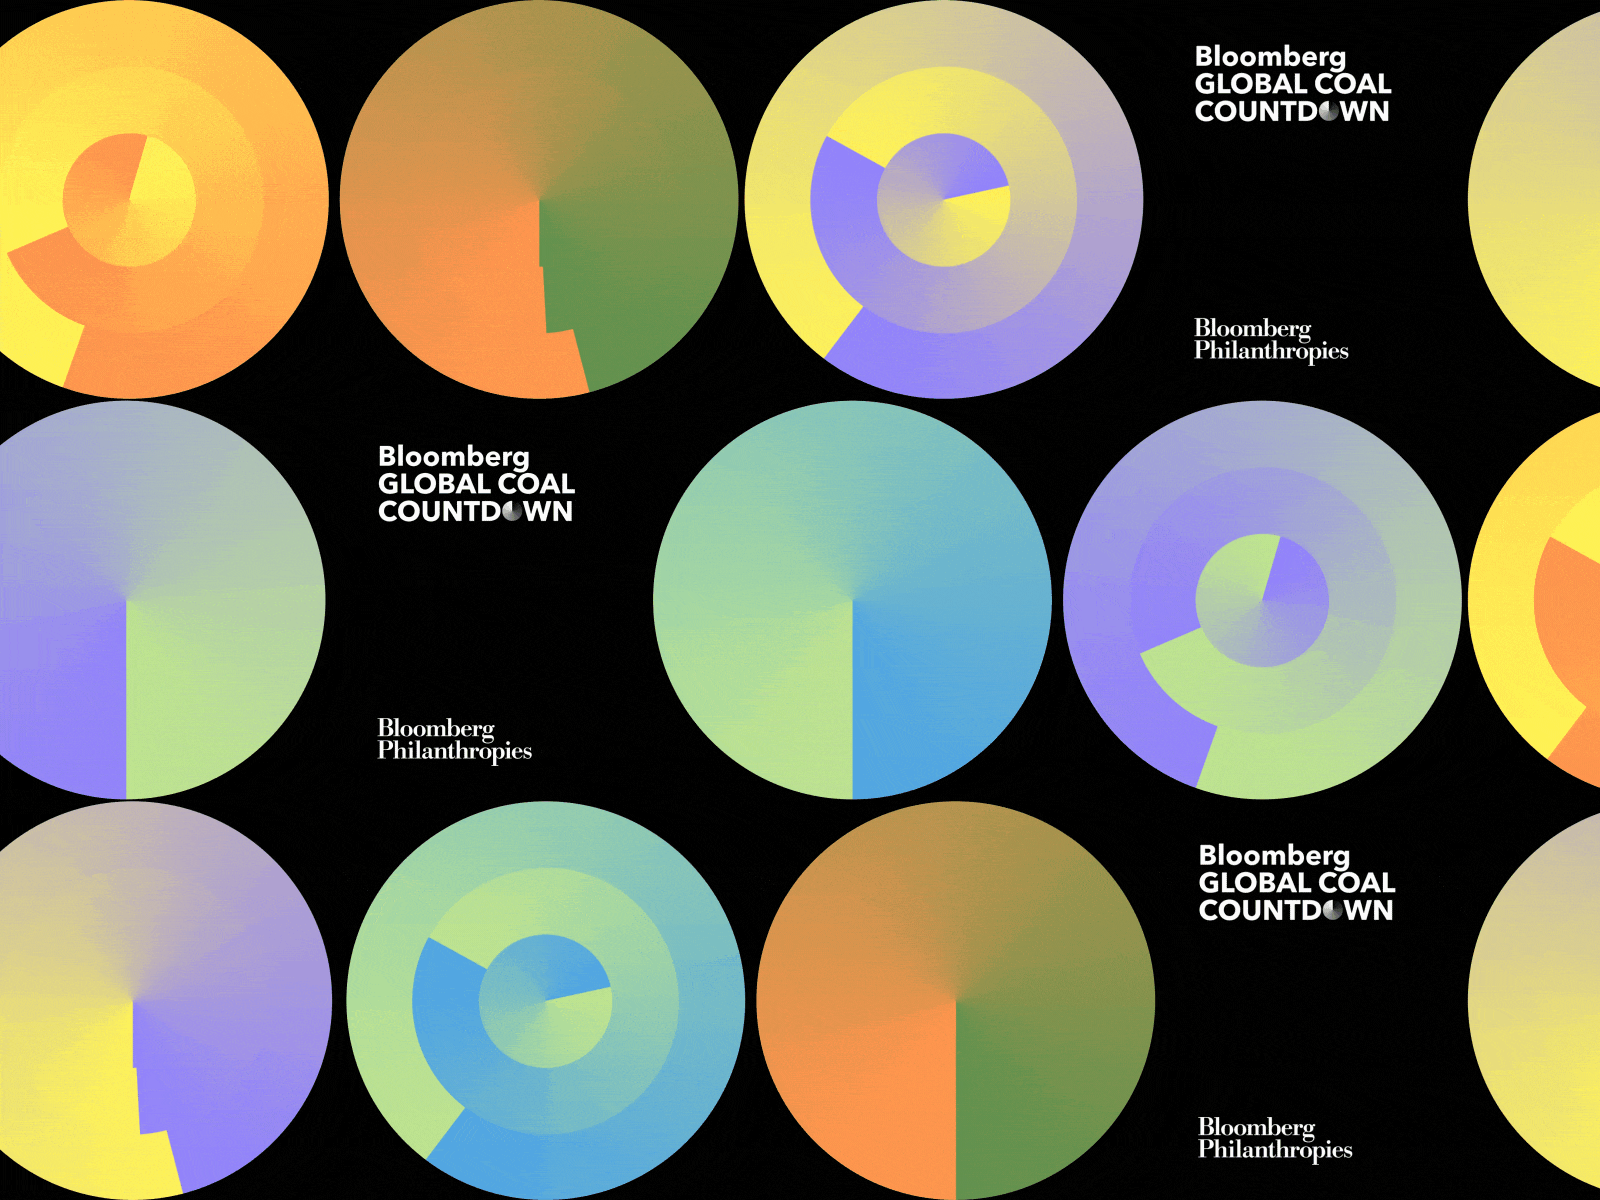
  18. Bloomberg Coal — New portfolio update after effects algo animation circe color data data driven data visualisation dataviz design environment gradient graphic graphic design loop motion graphics palette
    View Bloomberg Coal — New portfolio update
    Bloomberg Coal — New portfolio update
    90
    20.7k
  19. Project Flow Chart approval clean flow chart process project revision simple
    View Project Flow Chart
    Project Flow Chart
    16
    7.5k
  20. Process Sediment fault lines geology process sediment
    View Process Sediment
    Process Sediment
    33
    2.4k
  21. Query Prometheus chart data fire flame graph illustration pie chart vector
    View Query Prometheus
    Query Prometheus
    81
    10.8k
  22. Twitter Infographic data visualization flat graph infographic pie chart vector
    View Twitter Infographic
    Twitter Infographic
    32
    7k
  23. Graphs illustration from Tokyo Illustrations 2.0 ⛩ chart design digital graphs illustration kapustin linear outline pie tokyo vector
    View Graphs illustration from Tokyo Illustrations 2.0 ⛩
    Graphs illustration from Tokyo Illustrations 2.0 ⛩
    41
    14.1k
  24. Scatter Plot chart data visualization scatter plot
    View Scatter Plot
    Scatter Plot
    33
    4.9k
Loading more…