Dribbble: the community for graphic design
Shots
Shots
Designers
Explore
Popular
New and Noteworthy
Product Design
Web Design
Animation
Branding
Illustration
Mobile
Typography
Print
Hire a Designer
Browse Designers
Submit a Project Brief
Post a Job
Hiring on Dribbble
Find Jobs
Blog
Sign up
Log in
Infographic
Facebook icon
Share
Twitter icon
Tweet
Copy
7 Shots
•
2 Designers
Markus Zeljak
Facebook icon
Share
Twitter icon
Tweet
Copy
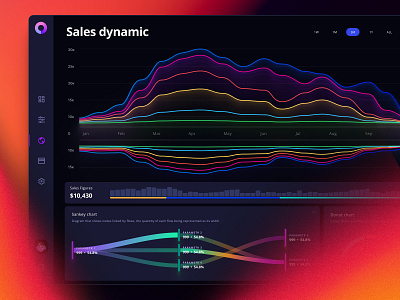
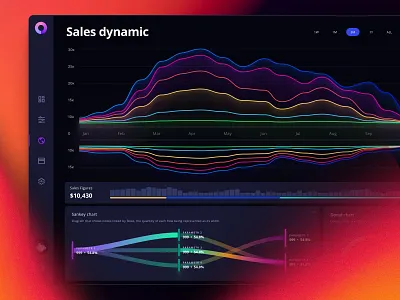
View Data visualization in the form of line graphs on the dashboard
Data visualization in the form of line graphs on the dashboard
Like
Setproduct
Team
Like
47
30.9k
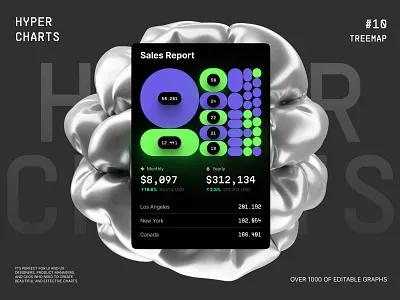
View Treemap graphs ✦ Hyper charts UI Kit
Treemap graphs ✦ Hyper charts UI Kit
Like
Setproduct
Team
Like
79
25.3k
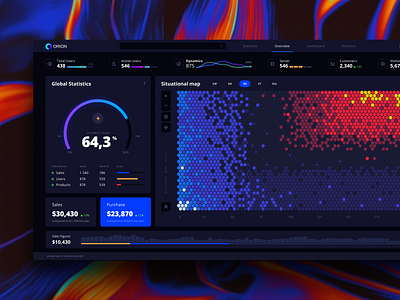
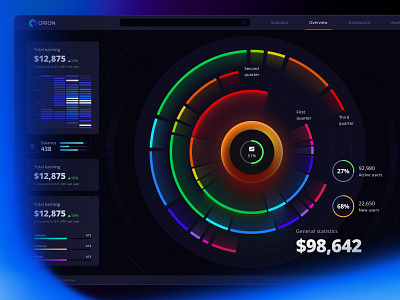
View Heatmap template / Orion UI kit
Heatmap template / Orion UI kit
Like
Setproduct
Team
Like
182
126k
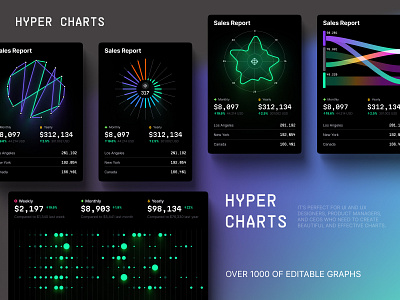
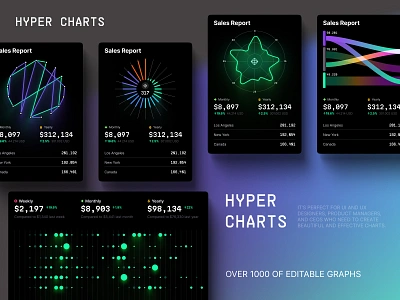
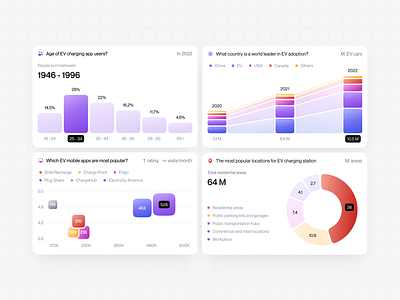
View Make Impactful Data Visualizations in Figma with Hyper Charts UI
Make Impactful Data Visualizations in Figma with Hyper Charts UI
Like
Alien pixels
Pro
Like
86
20.3k
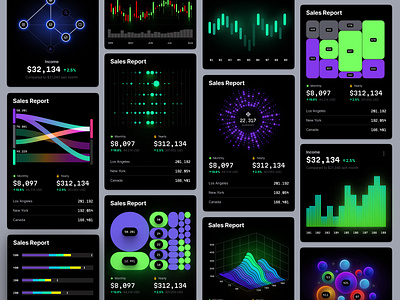
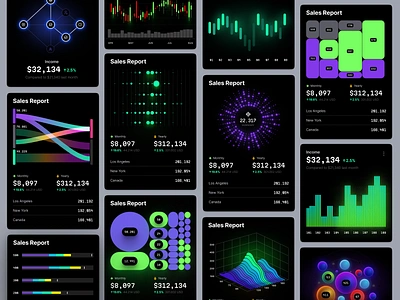
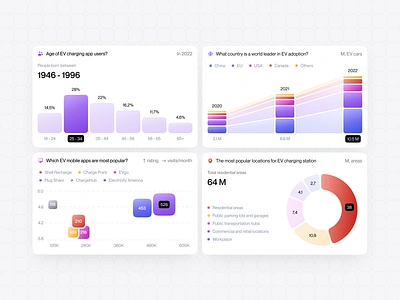
View Hyper charts UI Kit
Hyper charts UI Kit
Like
Setproduct
Team
Like
103
22.8k
View Orion UI kit for Figma has been updated
Orion UI kit for Figma has been updated
Like
Setproduct
Team
Like
108
51.1k
1
View Interviews and data | Charts and graphs | Analysis data
Interviews and data | Charts and graphs | Analysis data
Like
Fireart Studio
Team
Like
714
268k
Sign up to continue
Loading more…
Previous
Next
Loading…