1. Analysis analytics clean cluster convergence data flat interface node.js ui video
    View Analysis
    Analysis
    488
    22.8k
  2. Mini Stats UI circle clean colours date days design dribbble facebook flat graph profile ramil derogongun retro social statistics stats time twitter typography ui ui design ui kit ux views web weekdays widget
    9+
    View Mini Stats UI
    Mini Stats UI
    941
    67.6k
  3. Wireframing analytics app application charts dashboard data fluid graphs numbers sketch stats ui web wireframe
    View Wireframing
    Wireframing
    141
    7.1k
  4. Groupon Infographic - In Comparison chart data graph infographic information graphic line line chart stats visualization
    View Groupon Infographic - In Comparison
    Groupon Infographic - In Comparison
    257
    18k
  5. Engaged Minutes analytics chart data data visualization graph real time realtime visualization
    View Engaged Minutes
    Engaged Minutes
    229
    11.4k
  6. Infographic Preview data data viz icons infographic stats visualization
    View Infographic Preview
    Infographic Preview
    215
    10.2k
  7. Website Analytics Dashboard analytics app application chart clean dashboard data visualization design ecommerce flat graphs interface pie stats ui user interface design
    View Website Analytics Dashboard
    Website Analytics Dashboard
    451
    47.5k
  8. Glyph 2.0 Website analytics app card credit data missed rewards spending utilization
    View Glyph 2.0 Website
    Glyph 2.0 Website
    569
    38.9k
  9. Infographic chart data data viz graph sales
    View Infographic
    Infographic
    572
    34.2k
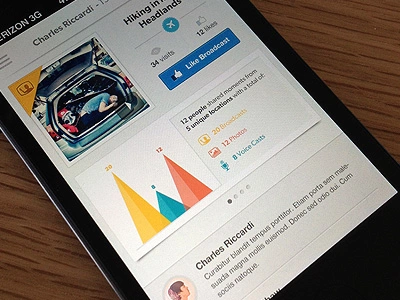
  10. Stats Data app broadcast button color info graphic ios iphone photo ui video visual data
    View Stats Data
    Stats Data
    554
    32.1k
  11. Simple Stocks Stats 11 data graph line chart numbers sss ui
    View Simple Stocks Stats
    Simple Stocks Stats
    881
    45.9k
  12. It's about to get social analytics dashboard data data visualization events social social analytics stream visualization
    View It's about to get social
    It's about to get social
    1.1k
    92.9k
  13. Dashboard UI activity admin breadcrumbs chart dashboard data design dwaiter graph interface login panel tabs ui ux
    View Dashboard UI
    Dashboard UI
    45
    10.4k
  14. App dashboard data visualization app chart dashboard data visualition graph infographic typography
    View App dashboard data visualization
    App dashboard data visualization
    36
    1.8k
  15. Important Data chart graph infographic
    View Important Data
    Important Data
    58
    2.9k
  16. Chartbeat Infographic Part 2 chart data graph infographic visualization
    View Chartbeat Infographic Part 2
    Chartbeat Infographic Part 2
    78
    3.5k
  17. HOM research2 charts colorful data graphic graphs info info graphics infographic information information graphics visualization
    View HOM research2
    HOM research2
    95
    5.5k
  18. Tracker And Dashboard 1c charts data visualization devices electronics fitbit gadgets graphs oled
    View Tracker And Dashboard 1c
    Tracker And Dashboard 1c
    100
    7.8k
  19. Timeline UX Legend app application data visualization design icons infographics ux web design
    View Timeline UX Legend
    Timeline UX Legend
    138
    11.9k
  20. Groupon Infographic chart data donut graph graphic infographic information information graphic map pie stats visualization
    View Groupon Infographic
    Groupon Infographic
    182
    13.1k
  21. Movies of 2011 bar chart circle graph infographic line movie numbers tv
    View Movies of 2011
    Movies of 2011
    24
    2.6k
  22. Simple Stocks Stats 11 app chart data finance graph green interface ios ios app iphone line chart numbers sa stats stocks ui
    View Simple Stocks Stats
    Simple Stocks Stats
    1.3k
    95.1k
  23. Infographic Postcard data graph helvetica icons infographic visualization
    View Infographic Postcard
    Infographic Postcard
    1.4k
    95.9k
Loading more…