1. Google Ventures Year in Review 2014 google ventures gv infographic infographics year in review
    View Google Ventures Year in Review 2014
    Google Ventures Year in Review 2014
    351
    22.6k
  2. Survey Platform Graph Design | UX, UI, iOS
    View Survey Platform Graph Design | UX, UI, iOS
    Survey Platform Graph Design | UX, UI, iOS
    786
    110k
  3. Graph Module clean design gradient graph material minimal modern price purple web web design website
    View Graph Module
    Graph Module
    91
    10k
  4. RedMetrics Homepage charts data graphs hero homepage icons illustration landing responsive ui web web design
    View RedMetrics Homepage
    RedMetrics Homepage
    313
    15.4k
  5. Tapcore Dashboard Redesign analytics charts clean dashboard data experience interface reports tapcore ui user ux
    View Tapcore Dashboard Redesign
    Tapcore Dashboard Redesign
    488
    31.6k
  6. Invoices Dashboard admin app chart clean dashboard data graph light statistics typography ui ux
    5
    View Invoices Dashboard
    Invoices Dashboard
    355
    28.3k
  7. Analytics Dashboard - Mobile add analytics app customize dashboard data graph interface notifications ui web widget
    1
    View Analytics Dashboard - Mobile
    Analytics Dashboard - Mobile
    347
    47.4k
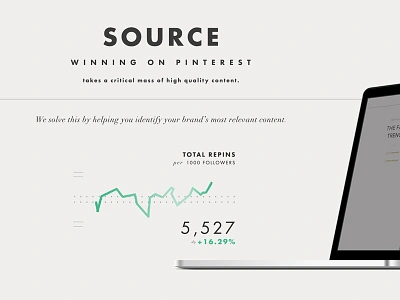
  8. New things are coming... app application dashboard data didot futura gradient pinterest sparkline typography ui whitespace
    View New things are coming...
    New things are coming...
    276
    13.1k
  9. Visual Data chart charts circle graph data graphs interface ui user interface
    View Visual Data
    Visual Data
    337
    17.4k
  10. Charts ui application blue charts data grey interface museo stats ui
    View Charts ui
    Charts ui
    379
    17.3k
  11. Elastica - Platform applications controls data graph haraldur it platform policy service spider tech technology
    1
    View Elastica - Platform
    Elastica - Platform
    430
    28.1k
  12. Live Dashboards animation charts dashboard data graph icon illustration microsoft power bi ui visualizations
    View Live Dashboards
    Live Dashboards
    444
    53.1k
  13. Dashboard Card Concepts admin analytics dashboard data fynder reports ui ux
    View Dashboard Card Concepts
    Dashboard Card Concepts
    493
    46.9k
  14. Day 006 - Currency Status chart currency dashboard data graph interface money statistic stats stock ui widget
    View Day 006 - Currency Status
    Day 006 - Currency Status
    590
    46k
  15. Transparency - area chart area chart data infographic slider ui web
    View Transparency - area chart
    Transparency - area chart
    685
    78.4k
  16. Askdata Data Visualization Concept app contemporary dashboard design minimal social ui user experience user interface ux web app
    View Askdata Data Visualization Concept
    Askdata Data Visualization Concept
    692
    38k
  17. Dashboard Analytics (WIP) analytics charts dashboard data tables ui user interface ux web app
    1
    View Dashboard Analytics (WIP)
    Dashboard Analytics (WIP)
    683
    66.5k
  18. Sagram - Pie Chart Animation analytics app application button buttons chart dashboard data graph icons navigation pie chart
    View Sagram - Pie Chart Animation
    Sagram - Pie Chart Animation
    731
    68.5k
  19. Agile CRM - Home Ver2 analytics balkan brothers charts clean crm dashboard data interface tasks ui user experience ux
    View Agile CRM - Home Ver2
    Agile CRM - Home Ver2
    1.3k
    105k
  20. Designer Time Tracking App II ae aftereffect animation chart dashboard data gif graph interaction ui ux visualization
    View Designer Time Tracking App II
    Designer Time Tracking App II
    1.1k
    112k
  21. Energy Predictions analytics chart china cold dashboard data energy graph infographic kingyo ui
    View Energy Predictions
    Energy Predictions
    2k
    182k
  22. Power Chart analytics card chart china dashboard data energy graph infographic kingyo material material design
    View Power Chart
    Power Chart
    2.9k
    333k
  23. Stats Exploration analytics chart dashboard data graph product statistics stats ui
    View Stats Exploration
    Stats Exploration
    1.6k
    112k
Loading more…