1. Analytics Dashboard analytics chart dashboard data form graph grid interface metrics ui ux wireframe
    2
    View Analytics Dashboard
    Analytics Dashboard
    126
    12.3k
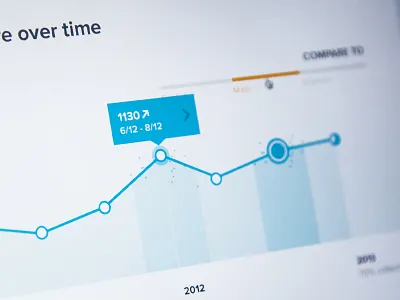
  2. Transparency - area chart area chart data infographic slider ui web
    View Transparency - area chart
    Transparency - area chart
    685
    78.4k
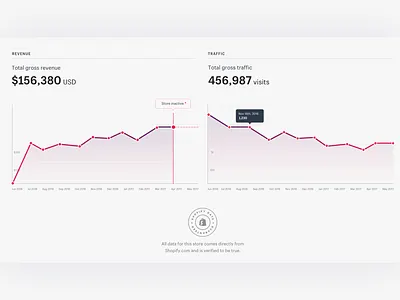
  3. Exchange – Revenue & Traffic Graphs buy charts data gradient graphs purple revenue sell shopify stores traffic
    View Exchange – Revenue & Traffic Graphs
    Exchange – Revenue & Traffic Graphs
    115
    19.6k
  4. Data Visualization - Graph Library area chart chart dashboard data data visualization donut chart graph library line chart polar sparkline statistics
    View Data Visualization - Graph Library
    Data Visualization - Graph Library
    90
    22.6k
  5. Statistics (General trends) dashboard data design flat graph ios statistics stats ui
    View Statistics (General trends)
    Statistics (General trends)
    1.7k
    181k
  6. Simple Goal bank banking card chart credit debit design graph simple ui
    View Simple Goal
    Simple Goal
    254
    22k
  7. Power Chart analytics card chart china dashboard data energy graph infographic kingyo material material design
    View Power Chart
    Power Chart
    2.9k
    333k
  8. Wizard Concept animation dashboard data flat gif gui icon icons inspiration stats ui ux
    View Wizard Concept
    Wizard Concept
    273
    19.2k
  9. Bills Bills Bills activity admin app application bills clean console dashboard electricity fire flat identity interface layout minimal ui ux water web widget
    1
    View Bills Bills Bills
    Bills Bills Bills
    3.6k
    427k
  10. Detailed Insight
    View Detailed Insight
    Detailed Insight
    240
    11.3k
  11. Web Platform Dashboard categories coupon local best deals manager dashboard planning organizing ramotion design shopping application management user experience user interaction ux ui web application website
    View Web Platform Dashboard
    Web Platform Dashboard
    551
    67.2k
  12. Time Slider Dashboard backend dashboard date slider time
    View Time Slider Dashboard
    Time Slider Dashboard
    86
    5.9k
  13. Dashboard Charts charts dashboard graph noise temperature
    1
    View Dashboard Charts
    Dashboard Charts
    33
    3.2k
  14. AC Reports app bar chart dashboard graph line pie report timeline web website
    View AC Reports
    AC Reports
    128
    14.7k
  15. Graphicals app clean design interface table ui user interface
    View Graphicals
    Graphicals
    258
    8.6k
  16. Probability theory chart dashboard data design graph interface ios statistics stats ui
    View Probability theory
    Probability theory
    1.9k
    195k
  17. Pie Charts doughnut graph infographic pie chart
    View Pie Charts
    Pie Charts
    59
    5.6k
  18. Site Analytics #2 - Burt analytics app burt button data gothenburg graph icon psd sidebar ui web
    View Site Analytics #2 - Burt
    Site Analytics #2 - Burt
    348
    17.8k
  19. Stats bar chart dashboard data design graph interface ios kit statistics stats ui
    View Stats
    Stats
    641
    75.6k
  20. Elastica - Discovery change cloud dropbox overview product design score security service slider spider spider graph web app
    View Elastica - Discovery
    Elastica - Discovery
    811
    62.5k
  21. Activity activity chart data flat graph infographic minimal simple summary timeline ui user interface
    1
    View Activity
    Activity
    1.6k
    125k
  22. Dashboard account chart comment dashboard interface issues projects statistic ui ux
    View Dashboard
    Dashboard
    360
    26.8k
  23. Sparkline clean data data visualization flat chart graph minimal minimal graph spark line sparkline stats trend web
    View Sparkline
    Sparkline
    521
    36.6k
  24. Simple Stats chart data graph info medium numbers stats ui
    View Simple Stats
    Simple Stats
    2.7k
    162k
Loading more…