Dribbble: the community for graphic design
Shots
Shots
Designers
Explore
Popular
New and Noteworthy
Product Design
Web Design
Animation
Branding
Illustration
Mobile
Typography
Print
Hire a Designer
Browse Designers
Submit a Project Brief
Post a Job
Hiring on Dribbble
Find Jobs
Blog
Sign up
Log in
Data Visualization
Facebook icon
Share
Twitter icon
Tweet
Copy
9 Shots
•
7 Designers
Bryan J. Harney
Facebook icon
Share
Twitter icon
Tweet
Copy
Shot Link
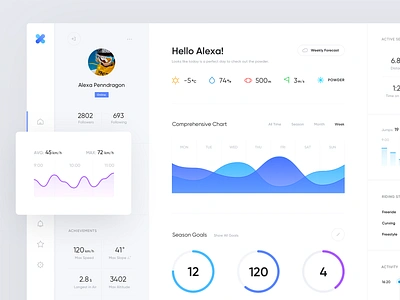
View Snowboarding Stats Dashboard
Snowboarding Stats Dashboard
Like
Den Klenkov
Pro
Like
1.1k
340k
Shot Link
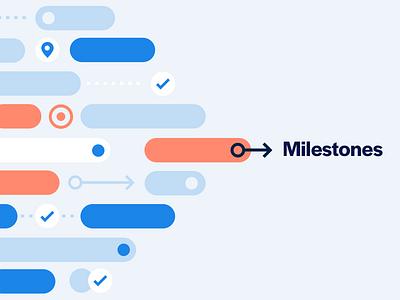
View Milestones
Milestones
Like
Opendoor Design
Team
Like
453
191k
Shot Link
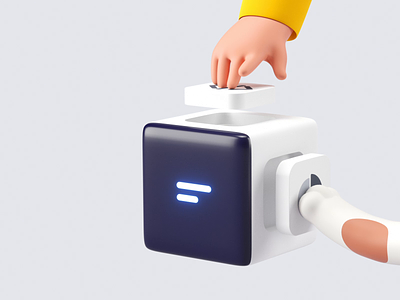
View Integrations
Integrations
Like
Pitch
Team
Like
2k
342k
2
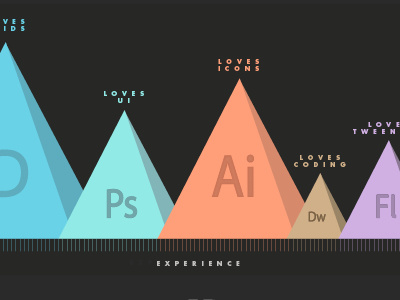
View SJQ - Experience/Enjoyment presentation
SJQ - Experience/Enjoyment presentation
Like
MadeByStudioJQ
Like
180
14.8k
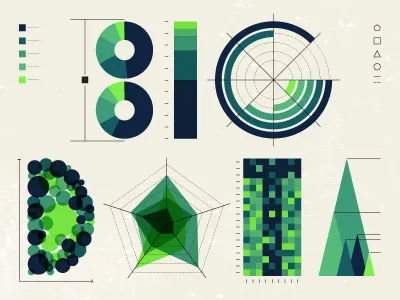
View BIG DATA
BIG DATA
Like
Van Run
Like
152
10.7k
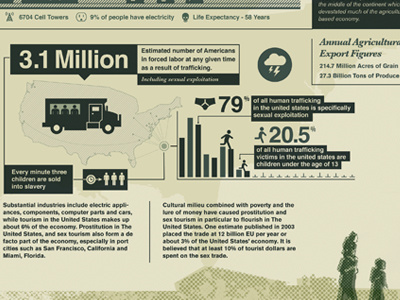
View Infographic - Made in America
Infographic - Made in America
Like
Jon Lewis
Like
5
497
2
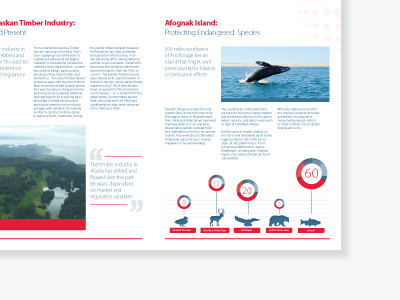
View Brochure layout for a clean energy company 2
Brochure layout for a clean energy company 2
Like
MadeByStudioJQ
Like
83
8.9k
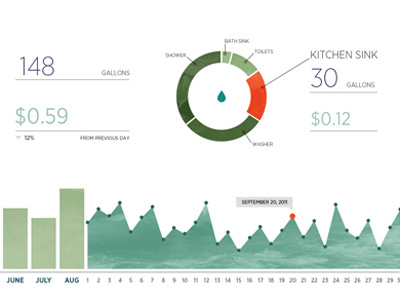
View Energy Graph 2
Energy Graph 2
Like
Hope Reynolds
Like
40
2.6k
2
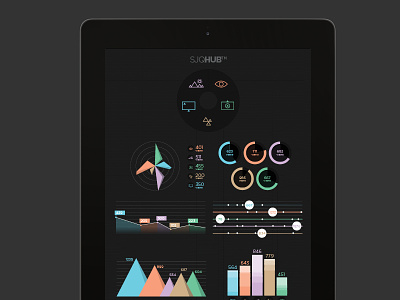
View SJQHUB™ Visual Data 4
SJQHUB™ Visual Data 4
Like
MadeByStudioJQ
Like
204
14.7k
Sign up to continue
Loading more…
Previous
Next
Loading…