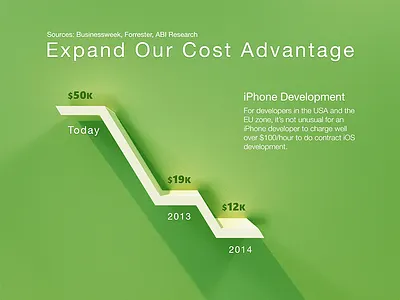
1. Dramatic Presentation Design chart presentation
    View Dramatic Presentation Design
    Dramatic Presentation Design
    1.2k
    46.1k
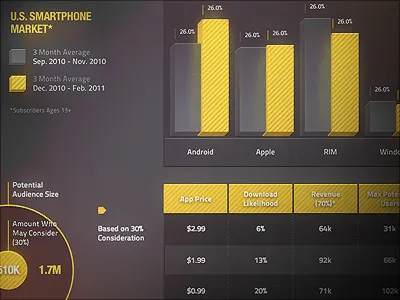
  2. Dramatic Change in Design Presentation chart presentation
    1
    View Dramatic Change in Design Presentation
    Dramatic Change in Design Presentation
    1.6k
    54.5k
  3. Color E-Paper Chart chart presentation
    3
    View Color E-Paper Chart
    Color E-Paper Chart
    572
    28.9k
  4. Chart / Table In Progress (Less Blur) chart graph info graphic keynote
    View Chart / Table In Progress (Less Blur)
    Chart / Table In Progress (Less Blur)
    242
    24.9k
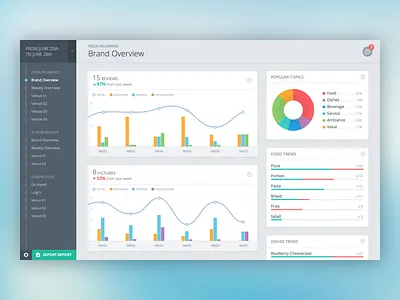
  5. Skimbl - Report chart dashboard data graph report skimbl stat
    View Skimbl - Report
    Skimbl - Report
    389
    24.9k
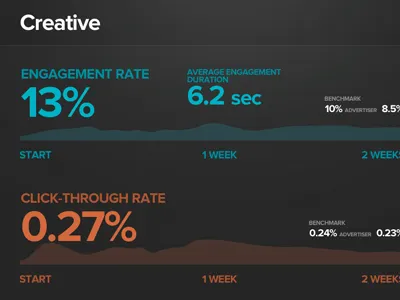
  6. Creative – Deck slide app apple creative dark data dataviz deck graph highlight infographic infoviz keynote linegraph metrics numbers presentation product slide sparkline statistics ui viz
    View Creative – Deck slide
    Creative – Deck slide
    335
    25.9k
  7. Dashboard Activity section @ app dashboard facebook graphs heights india ipad line rate saurabhj sbj social twitter ui web
    View Dashboard Activity section
    Dashboard Activity section
    406
    27.2k
  8. Infographic Poster Full banner design graphs info infographic poster timeline
    View Infographic Poster Full
    Infographic Poster Full
    1.1k
    109k
  9. Charting 5 years of MLB homeruns baseball blue chart dark data graph green infograph infographic maps mlb numbers red stats
    View Charting 5 years of MLB homeruns
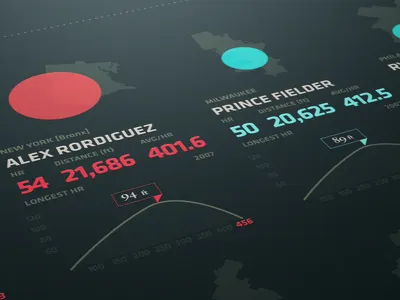
    Charting 5 years of MLB homeruns
    1.4k
    120k
  10. Graph interactive rally rally interactive
    View Graph
    Graph
    1.2k
    67.2k
  11. Infographic Postcard data graph helvetica icons infographic visualization
    View Infographic Postcard
    Infographic Postcard
    1.4k
    95.9k
  12. Simple Stats chart data graph info medium numbers stats ui
    View Simple Stats
    Simple Stats
    2.7k
    162k
  13. Dashboard chart dashboard graph line orange ui user interface widget
    9+
    View Dashboard
    Dashboard
    1.7k
    123k
  14. Webapp Dashboard dashboard flat flat design graph icons numbers pie chart stats ui web
    3
    View Webapp Dashboard
    Webapp Dashboard
    4k
    568k
  15. ios7 ios9 ios8 app design graphs graph button data glow graph header interface ios ios7 iphone menu mobile nav bar profile statistics stats ui
    View ios7 ios9 ios8 app design graphs graph
    ios7 ios9 ios8 app design graphs graph
    2.7k
    294k
  16. xenius infographics 3d after effects art machine bar brand identity chart graph green id identity info info graphic info graphics infographics information julian hrankov motion motion design orange television tv
    View xenius infographics
    xenius infographics
    3.3k
    205k
  17. Energy Graph 2 circle graph data graph info graphic visualization
    View Energy Graph 2
    Energy Graph 2
    40
    2.6k
  18. Energy Consumption graph slider
    View Energy Consumption
    Energy Consumption
    42
    2.1k
  19. Energy Monitor UI chart data energy graph infographic kingyo time ui
    1
    View Energy Monitor UI
    Energy Monitor UI
    221
    14.2k
  20. Time Energy chart data energy graph infographic kingyo time ui
    3
    View Time Energy
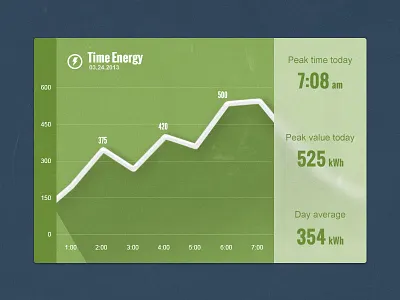
    Time Energy
    245
    15.5k
  21. Energy Monitor UI chart china data energy graph infographic iphone6 kingyo time ui
    1
    View Energy Monitor UI
    Energy Monitor UI
    603
    36k
  22. Flow Monitor chart china data energy graph infographic kingyo time ui
    View Flow Monitor
    Flow Monitor
    761
    48k
Loading more…