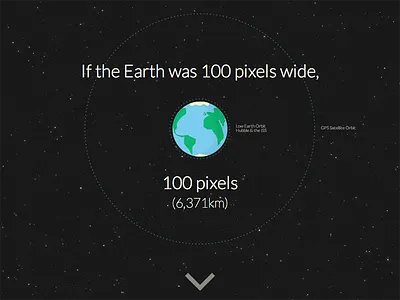
1. How Far is it to Mars? animated illustrated infographic javascript jquery mographic motion planets solar space system
    1
    View How Far is it to Mars?
    How Far is it to Mars?
    1.2k
    79.9k
  2. Steelcase 360 Magazine Infographics data visualization editorial infographic information design magazin
    View Steelcase 360 Magazine Infographics
    Steelcase 360 Magazine Infographics
    458
    27.8k
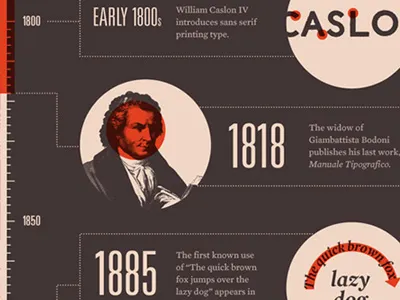
  3. Mashable Typeface Timeline font graphic history illustration info infographic nashville timeline typeface
    View Mashable Typeface Timeline
    Mashable Typeface Timeline
    381
    48.8k
  4. Mountains and Oceans Infographic book encyclopedia hill infographic information graphic mountain
    View Mountains and Oceans Infographic
    Mountains and Oceans Infographic
    390
    22.3k
  5. Facebook Infographic on Mashable facebook infographic mashable nashville timeline
    View Facebook Infographic on Mashable
    Facebook Infographic on Mashable
    292
    14.7k
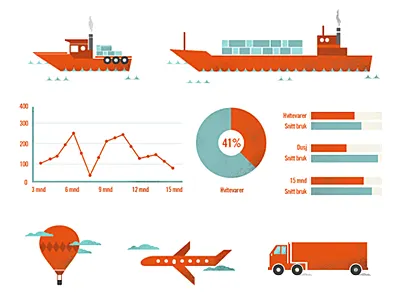
  6. Infographics illustration infographics
    View Infographics
    Infographics
    332
    17.4k
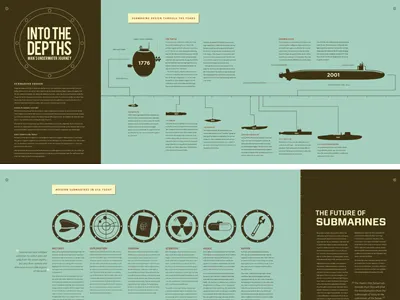
  7. Completed Submarine Infographic blue boat icons infographic sea submarine type typography vector
    View Completed Submarine Infographic
    Completed Submarine Infographic
    315
    19.2k
  8. Infographic (from space)
    View Infographic (from space)
    Infographic (from space)
    321
    10.8k
  9. Media Economy Report Infographic analytics data donut pie chart report statistic ui ux
    View Media Economy Report Infographic
    Media Economy Report Infographic
    527
    42.2k
  10. In-app Visual Data app blue buttons data icons info graphic infographic ios iphone red tab bar ui visual data yellow
    1
    View In-app Visual Data
    In-app Visual Data
    4.3k
    364k
  11. Magazine infographics charts graphics info infographics magazine uxebu
    View Magazine infographics
    Magazine infographics
    576
    35.4k
  12. Facebook: America Votes 2012 animation data desktop facebook fullscreen info graphic infographic interactive map mobile real time responsive svg visualization vote voters voting
    View Facebook: America Votes 2012
    Facebook: America Votes 2012
    559
    52.9k
  13. xenius infographics 3d after effects art machine bar brand identity chart graph green id identity info info graphic info graphics infographics information julian hrankov motion motion design orange television tv
    View xenius infographics
    xenius infographics
    3.3k
    204k
Loading more…