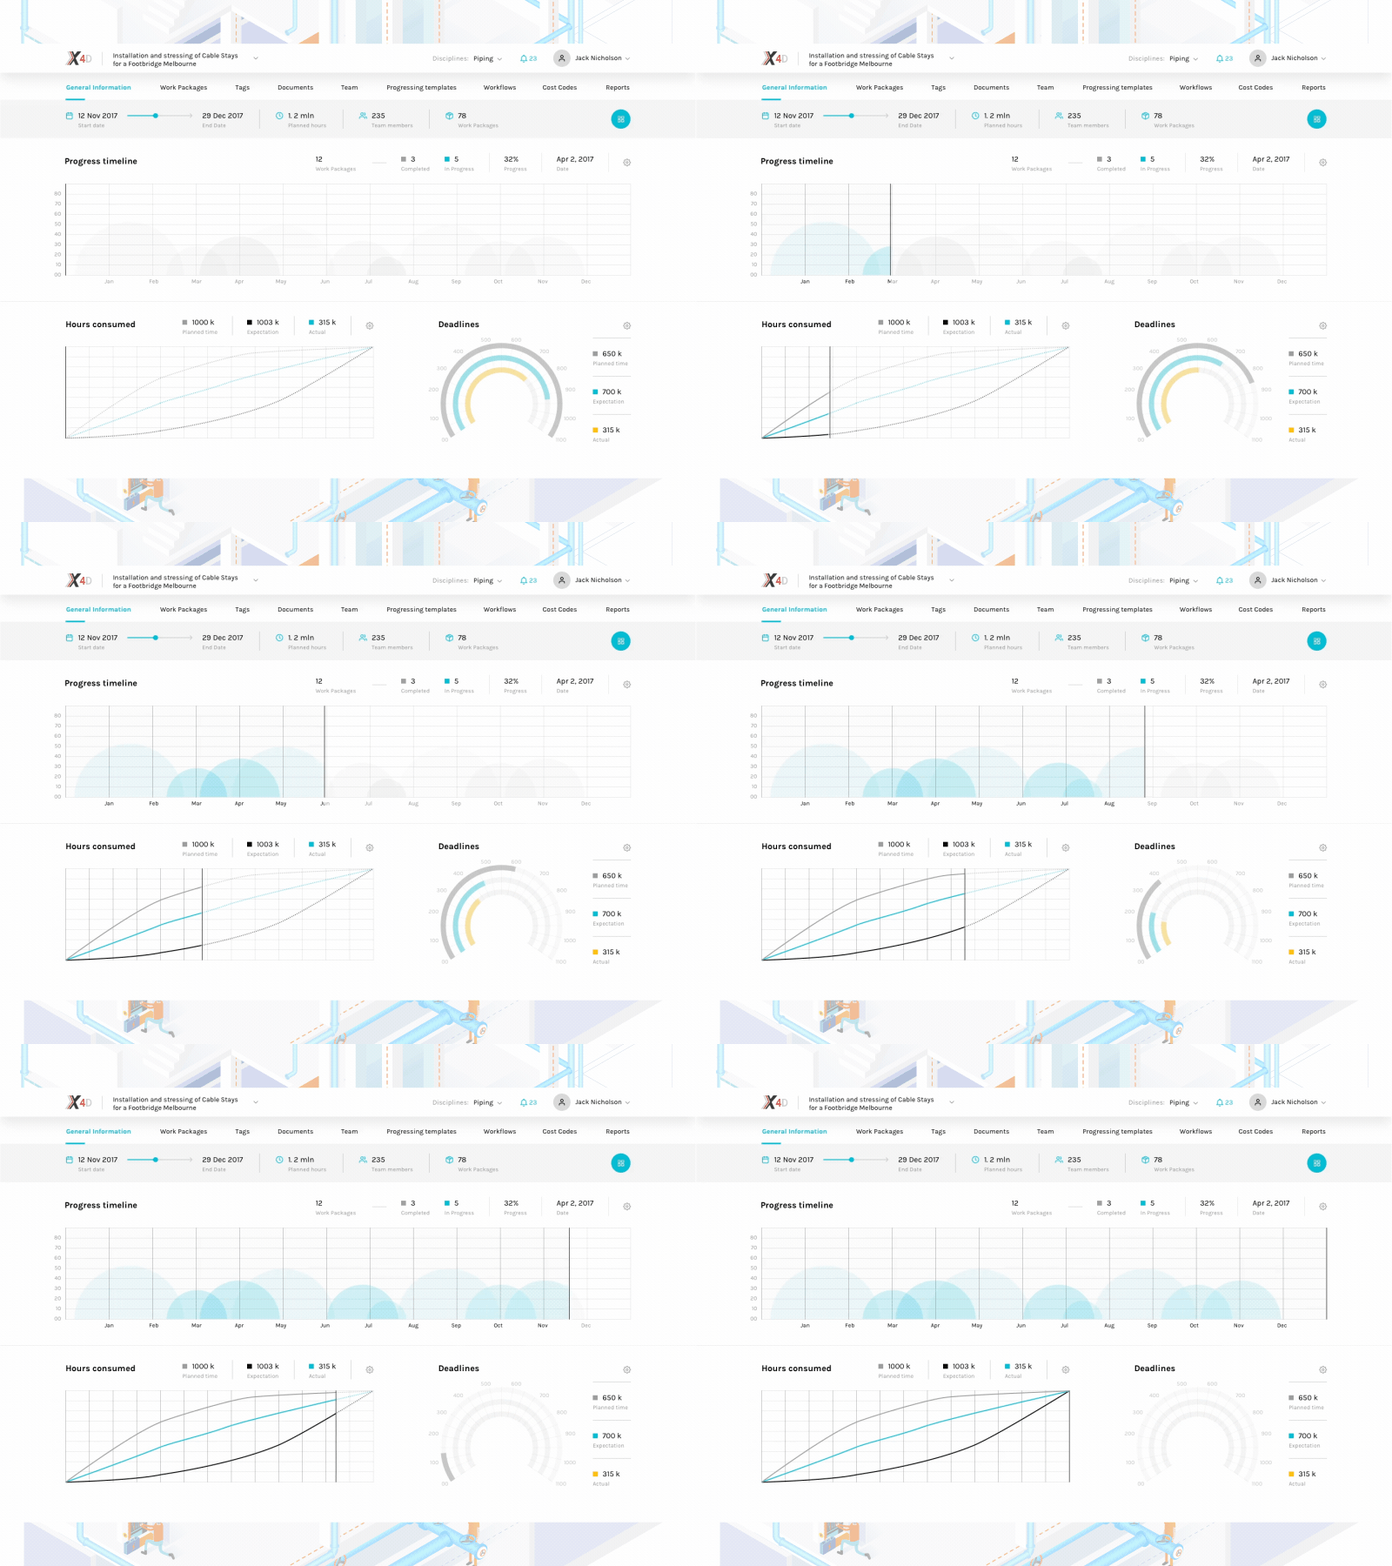
Dashboard Interface Charts
Some dashboard chart from X4D project.
The key function or asset of a dashboard is that behind the scenes, a dashboard connects your files, attachments, services and API’s. However, on the surface, dashboards display all this data in the form of tables, line charts, bar charts and gauges for easy and digestible data comprehension. To illustrate the usefulness of dashboard and intelligent interface design, we created an interactive experience to illustrate our approach.
Enjoy!
More by George Railean View profile
Like
