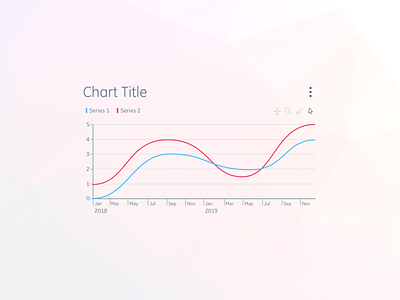
DailyUI - 018 - Analytics Chart
Understanding data trends over time is one of the most common tasks of analysts and engineers in the space I’m designing for. The aim here is quick and clear comprehension of charts through accessibility, simplicity, and consistency in sizes, ratios, and colors regardless of context or viewport.
More by Alex Lockwood View profile
Like
