TeliaSonera CRM Dashboard


Tele-Operator (for example TeliaSonera) wants to understand their customers and customer segments better via a dashboard/view of statistical information which visualizes the KPIs (Key Performance Indicators) of a TeliaSonera customer / customer segment within their CRM (customer relationship management) system.
User of this Dashboard will be target audience for this statistical view is the tele-operator’s marketing planners or business analysts who want to define better ways to serve their customers or to define better telecom products/campaigns for selected segments.
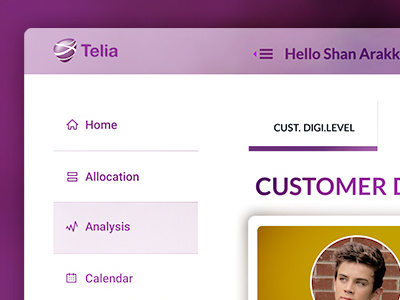
The Main Screen: The Customer Digitalization Level | which is defined per customer and per customer segments. The levels are derived from attributes through a special data set or analysis like. Average duration the phone is connected to internet, Date of last activity on data, Most listen artist on the mobile device , Number of websites customer visited in the last x days, Total data revenue earned in the last x days, Total data volume used in the last x days, Does the customer Active in Social networks.
Total monetary usage trend is Total monetary monthly usage for SMS, Voice and Data in a trend that visualizes the usage for past 5 months. Total usage is possible to drill down to total SMS usage, total voice usage and to total data usage .
Complaint history is defined as per customer and per customer segment, this screen will visualize 5 top reasons customer complaint within last X days with all the channels customer used for complaining that is self care, service center, call center, store etc.
Hope you guys like it!!