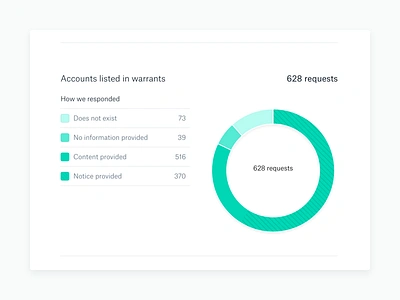
1. Transparency - by request type donut chart infographic pie chart reports table web
    View Transparency - by request type
    Transparency - by request type
    333
    67.2k
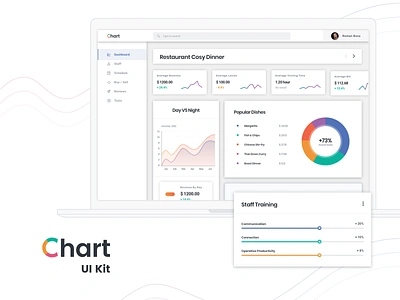
  2. Restaurant Business Analytics Software chart donut free legend linear pie plot progress sketch web
    View Restaurant Business Analytics Software
    Restaurant Business Analytics Software
    66
    47.7k
  3. Sales Dashboard Overview chart diagram donut free legend linear pie plot sketch web
    View Sales Dashboard Overview
    Sales Dashboard Overview
    50
    52.1k
  4. Personal task management summary bar chart comparison donut free pie plot progress sketch web
    View Personal task management summary
    Personal task management summary
    89
    156k
  5. Brandmates. Real-time analytics 🎯 analitycs app blue brandmates cards chart color graph interace pie chart saas ui web app
    View Brandmates. Real-time analytics 🎯
    Brandmates. Real-time analytics 🎯
    425
    102k
  6. Blog Header - Statistics analytics blog blog cover chart charts crypto data data analytics graphs grid grid illustration hellsjells illustration information paxful pie chart purple science statistics stats
    View Blog Header - Statistics
    Blog Header - Statistics
    295
    153k
  7. E-commerce analytics Dashboard chart donut free legend linear pie plot progress sketch web
    View E-commerce analytics Dashboard
    E-commerce analytics Dashboard
    48
    42.8k
  8. Investment service - Overview page chart donut free legend linear pie plot progress sketch web
    View Investment service - Overview page
    Investment service - Overview page
    60
    44.5k
  9. Data representation page chart donut free legend linear pie plot progress sketch web
    View Data representation page
    Data representation page
    57
    41.1k
  10. Investment service - Historical Data chart donut free legend linear pie plot progress sketch web
    View Investment service - Historical Data
    Investment service - Historical Data
    55
    38.3k
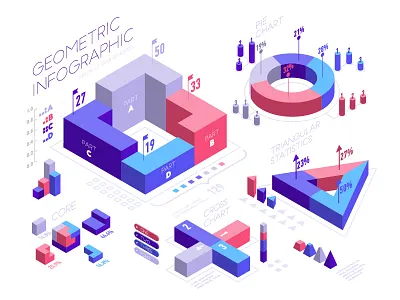
  11. Data visualization infographic isometric design 3d analisis chart data diagram graphic graphic deisgn graphic design growth illustration infographic design information isometric percentage pie chart report report design statistic vector web
    View Data visualization infographic isometric design
    Data visualization infographic isometric design
    226
    149k
  12. Interface Design build chart construction design graph interface pie ui website
    View Interface Design
    Interface Design
    267
    38k
  13. Social network activity interface chart comparison donut free legend linear pie plot sketch web
    View Social network activity interface
    Social network activity interface
    57
    60.2k
  14. Pie chart visualization #4 animation blockchain chart ico infographic landing page motion pie roadmap shadow visualization
    View Pie chart visualization #4
    Pie chart visualization #4
    414
    93.8k
  15. Landing page - Brandmates 👑 brandmates color eye illustration landing page photos pie chart ui ux design web website
    View Landing page - Brandmates 👑
    Landing page - Brandmates 👑
    534
    94.7k
  16. Pie chart blue chart graph illustration report ui ux web
    View Pie chart
    Pie chart
    98
    26.7k
  17. PJ Charts bar charts data date design line pie tooltip unfold webapp webdesign
    View PJ Charts
    PJ Charts
    214
    47.9k
  18. Using data visualization to tell compelling stories... abstract bar chart blog chart data visualisation data visualization data viz dribbble graph infographic interview pie chart science vintage
    View Using data visualization to tell compelling stories...
    Using data visualization to tell compelling stories...
    166
    79.3k
  19. Clothes e-commerce analytics dashboard chart comparison donut free legend linear pie plot polar sketch web
    View Clothes e-commerce analytics dashboard
    Clothes e-commerce analytics dashboard
    60
    60k
  20. Hero illustration basketball cards chart commentary design gradient graph homepage illustration pie player run running score social stats
    View Hero illustration
    Hero illustration
    1.6k
    330k
  21. Datasplash Website analytics application bar graph charts cloud data fun graph illustration line graph pie chart website
    View Datasplash Website
    Datasplash Website
    86
    20.3k
  22. Zeelandia - Homepage bakery homepage ingredient landing onepage pie product ui violet web website zeelandia
    View Zeelandia - Homepage
    Zeelandia - Homepage
    1.4k
    102k
  23. Apartments rental dashboard chart comparison donut free legend linear pie plot progress sketch web
    View Apartments rental dashboard
    Apartments rental dashboard
    55
    67.1k
  24. Fintech Widgets - frosted glass style bank bar chart blur chart credit card currency currency exchange finance fintech flat design form frosted glass glass design glassmorphism gradients line chart mobile app pie chart web widgets
    View Fintech Widgets - frosted glass style
    Fintech Widgets - frosted glass style
    277
    115k
Loading more…