-
191.8k
-
66426.2k
-
484.4k
-
8728
-
21592
-
311.8k
-
1596.9k
-
1057.3k
-
201k
-
211k
-
15633
-
616.1k
-
9516.9k
-
121.1k
-
11612.5k
-
182.6k


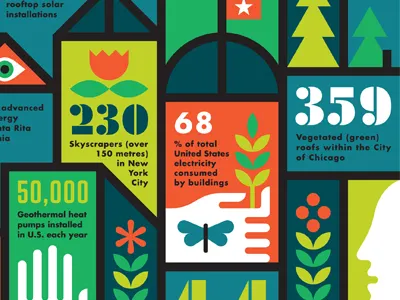


![[GIF] Simple Infographic Illustrations illustration infographic javin ladish money vector](https://cdn.dribbble.com/userupload/19323270/file/still-23edc389671417fa812a13ca1b6110d1.gif?resize=400x0)
![[GIF] Simple Infographic Illustrations illustration infographic javin ladish money vector](https://cdn.dribbble.com/userupload/19323270/file/still-23edc389671417fa812a13ca1b6110d1.gif?format=webp&resize=400x300&vertical=center)

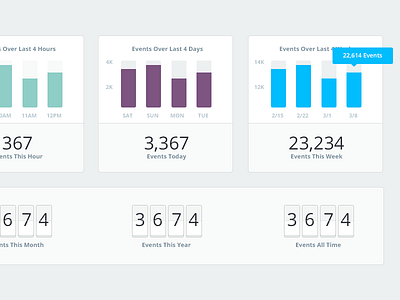
![[INFOGRAPHIC] SAAS IS BEAUTIFUL data driven data visualization flat design infographic infographics saas stats survey survey infographic visualisation visualization](https://cdn.dribbble.com/users/273193/screenshots/1238389/_shots_gif_still.gif?resize=400x0)
![[INFOGRAPHIC] SAAS IS BEAUTIFUL data driven data visualization flat design infographic infographics saas stats survey survey infographic visualisation visualization](https://cdn.dribbble.com/users/273193/screenshots/1238389/_shots_gif_still.gif?format=webp&resize=400x300&vertical=center)


Loading more…


